Portfolio summary
1 min read.
The “Summary” tab is the first tab in the app and gives you a live overview of your entire portfolio: current valuation, acquisition cost breakdown, holdings per metal, and sales performance.
Live Valuation
The top section shows the total current value of your portfolio, the balance (total value minus total cost), and the percentage gain or loss.
Tap the valuation mode button to switch between:
- Spot: values based on the spot price of each metal.
- Offer: values based on the current dealer offer price (Pro).
- Both: shows both spot and offer valuations side by side (Pro).
Below the balance, a horizontal bar chart shows how your portfolio value is distributed across metals, with each metal’s allocation percentage and currency value.
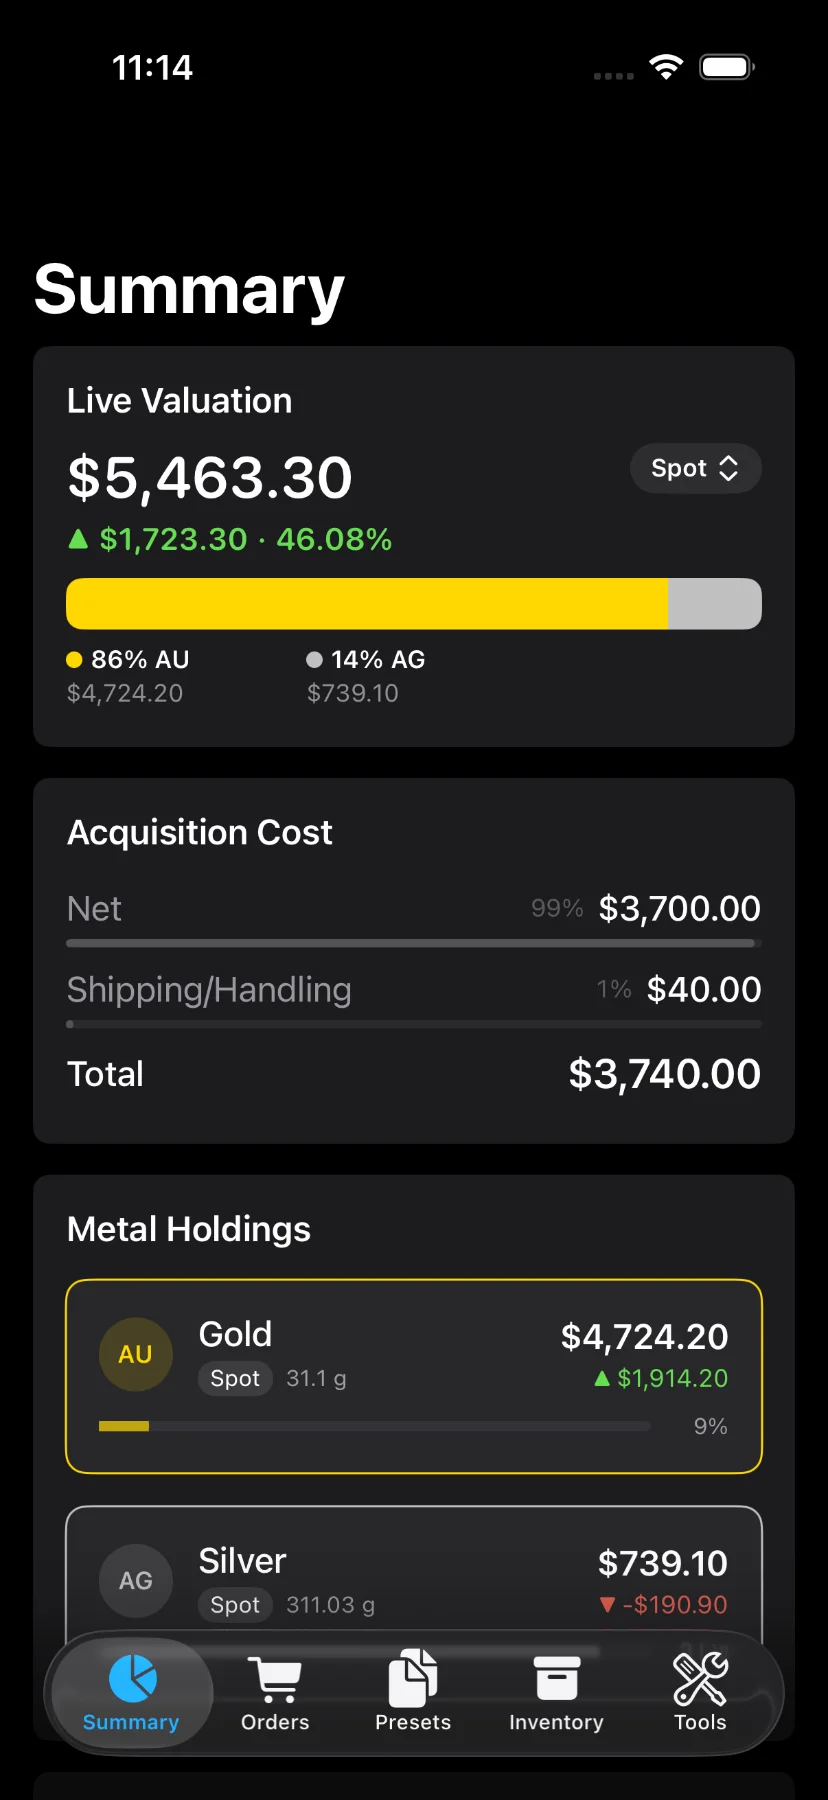
Acquisition Cost
The Acquisition Cost section breaks down what you paid:
- Net Cost
- Shipping (if applicable)
- Tax (if applicable)
- Total Acquisition Cost
Each line includes a progress bar showing its share of the total cost.
Metal Holdings
The Metal Holdings section lists each metal in your portfolio as a tappable row. Each row shows:
- Metal symbol and color
- Total weight in your preferred unit
- Current value
- Balance compared to acquisition cost
- A bar showing the metal’s share of total portfolio weight
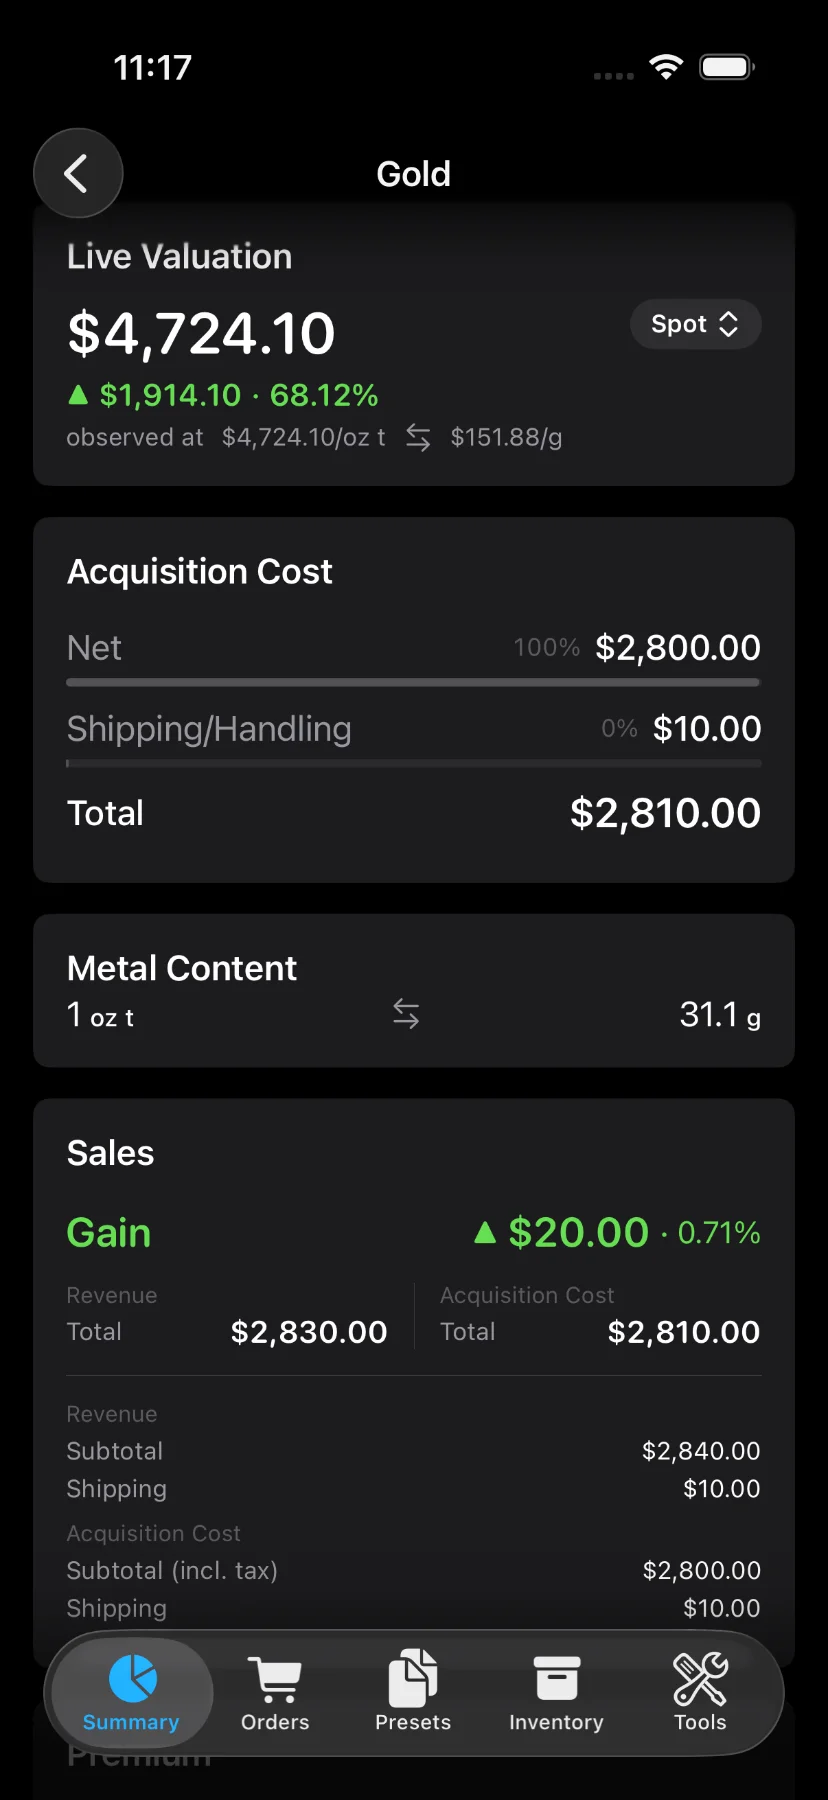
Tap a metal row to open its detail screen with a full breakdown for that metal.
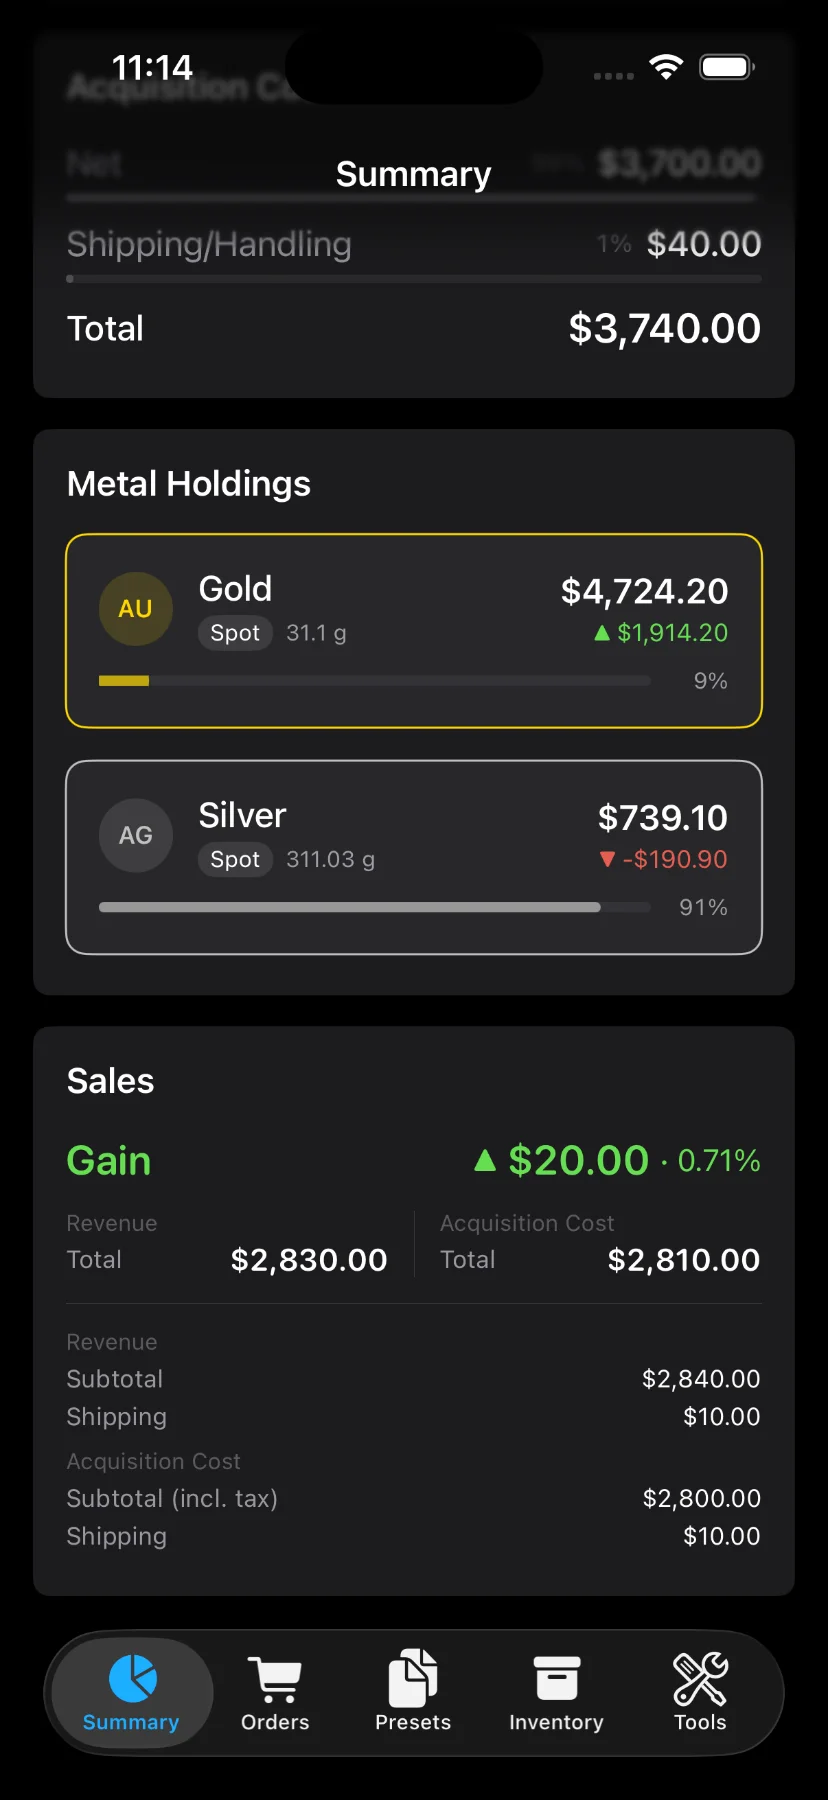
Metal Holdings is a Pro feature.
Sales
The Sales section summarizes all recorded sales across your portfolio:
- Total gain or loss with percentage
- Revenue (subtotal + shipping)
- Acquisition cost (subtotal + shipping + tax)
Refreshing prices
Pull down to refresh live prices from the market, or tap the refresh button in the toolbar.